Urban Heat Island
Urban Heat Island Mapping:
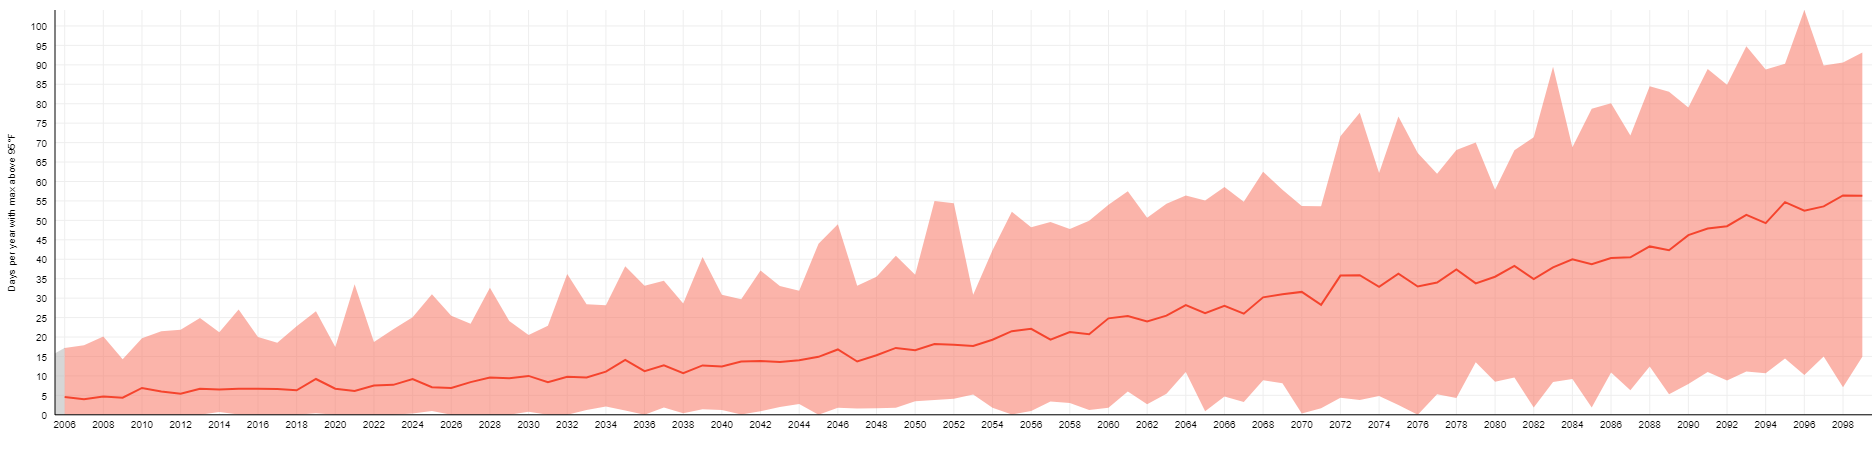
According to the National Integrated Heat Health Information System: “The frequency of heat waves in NYC has been increasing in recent years. However, its impact is disproportionately higher on racially and socio-economically marginalized neighborhoods such as the South Bronx – communities already burdened by environmental racism, leaving them with more exposure to polluting industries and often little to no green space in which to seek refuge from the heat and poor air quality. As a result, there are stark environmental health disparities: while African-Americans constitute just under 25% of NYC’s population, they made up almost half of those who lost their lives to heat between 2000 and 2012.”
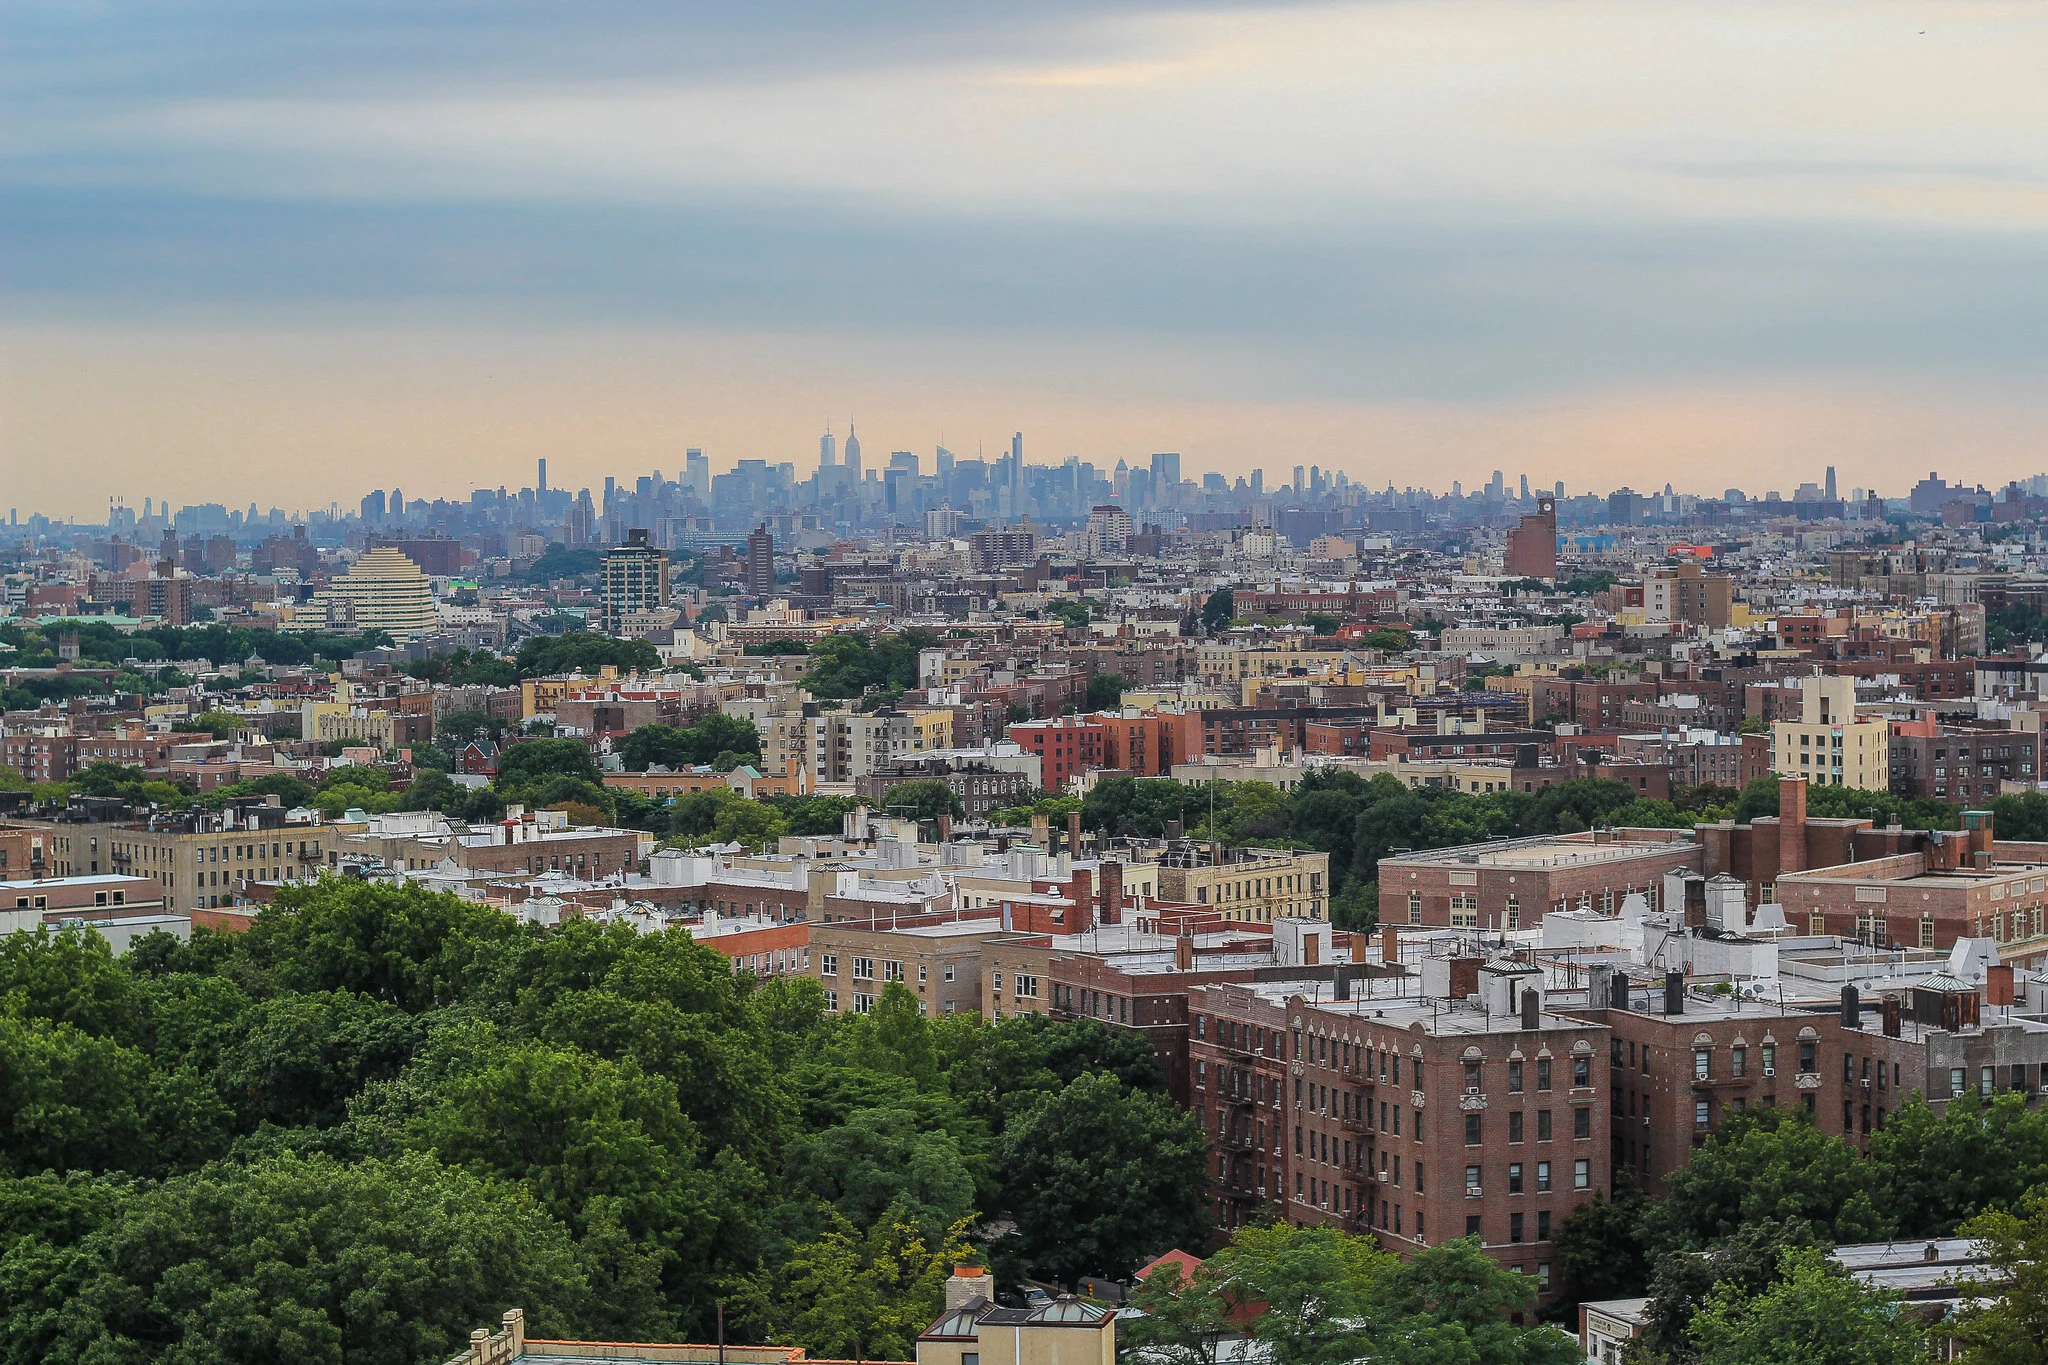
In partnership with Columbia University, we are working on an Urban Heat Island Mapping project, collecting environmental data about the hottest and coolest places in our area. Data collected by participants will be used to develop temperature and heat maps of NYC and identify action items at different levels of government, ranging from local community boards to the City, including expanding existing efforts targeted to vulnerable neighborhoods.